Sometimes it can feel like making sense of Chicago’s real estate market is like trying to predict the spring weather. One headline says the market is cooling, while another one says prices are on the rise. Meanwhile, you’re just trying to figure out if now is actually a good time to make a move.
We’re the Ben Lalez Team, and we’re here to tell you that the market isn’t just one single story. It’s multiple stories happening at the same time across all 77 unique neighborhoods in Chicago.
So let’s have a quick breakdown of what’s actually happening in Chicago right now. We’re not talking about national trends or clickbait headlines. Just real numbers that give you something to work with.
We’ll cover what’s happened over the past 12 months, so grab a cup of coffee and let’s dive in!
A Market Of Three Different Performers
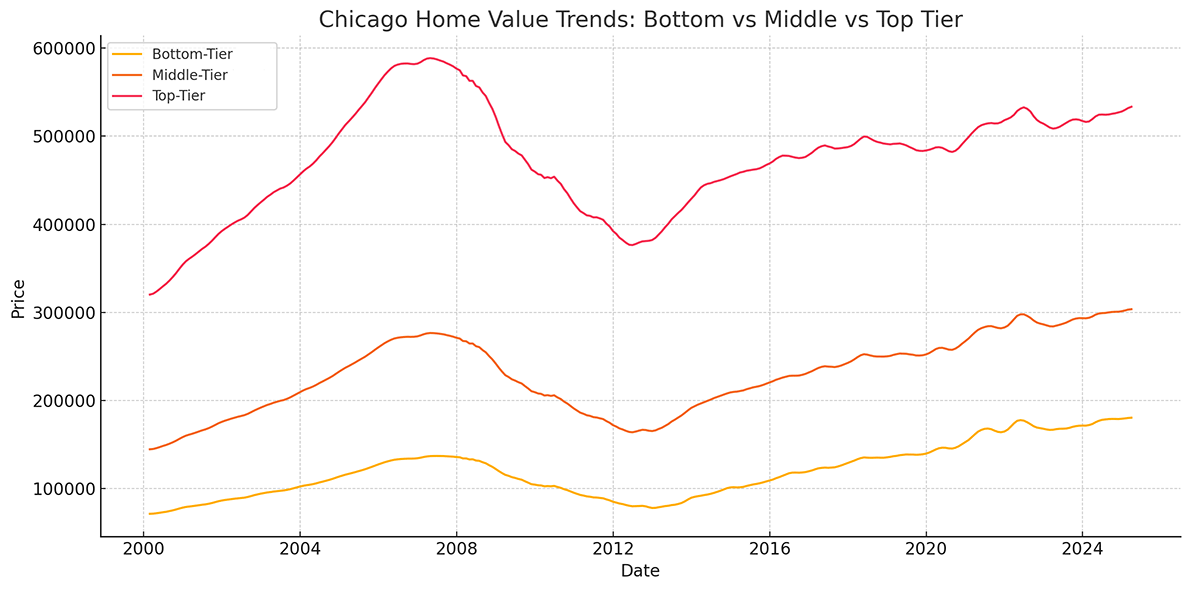
Let’s first divide the market into three segments (for reference, this data is taken from Zillow’s housing data). We have the Top-Tier homes (homes values within the 65th to 95th percentile range), Bottom-Tier homes (5th to 35th Percentile range), and the Middle-Tier homes (35th to 65th percentile range).
Since 2000, all three markets have performed similarly, but with wider swings and different measures of volatility.

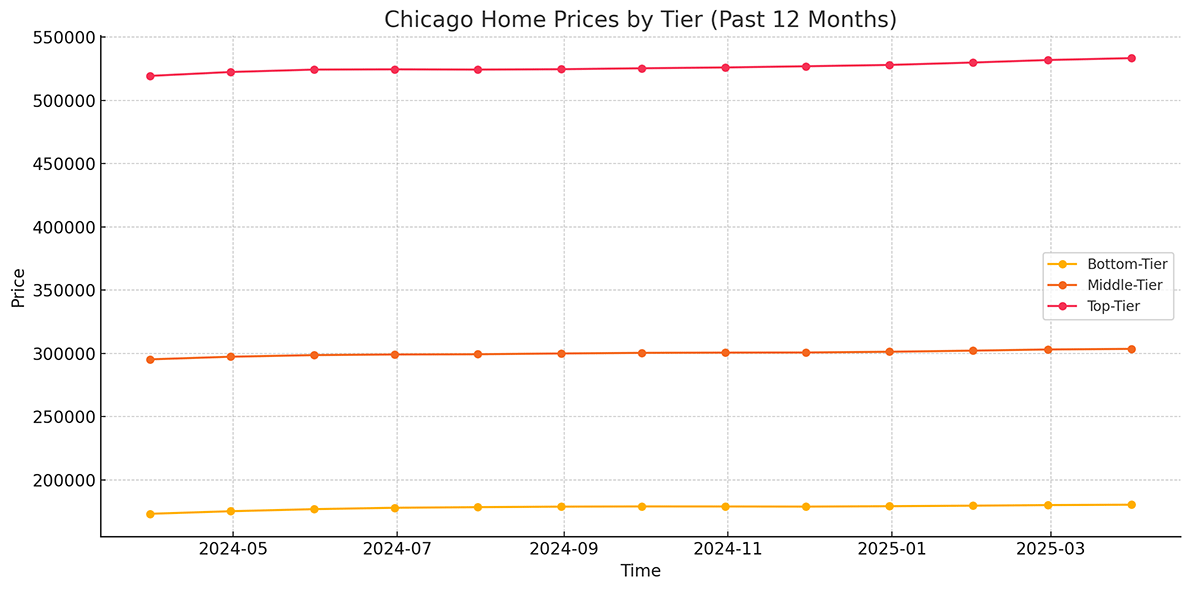
Historical data is useful to see where we’ve come over a long period of time, but what we want to do is look at what’s happened over the last 12 months to see the current state of the Chicago real estate market:

Here’s what the data shows:
- Bottom-Tier Homes:Up 4.14%
- Middle-Tier Homes: Up 2.81%
- Top-Tier Homes: Up 2.71%
What does this tell us?
The strongest demand is currently at the entry level. First-time homebuyers and investors are competing in the affordable segment and driving stronger price growth. Meanwhile, the luxury market is still growing, just at a reserved pace.
This pattern makes Chicago a little different from many other coastal markets where luxury properties are currently outpacing other segments. Here in our city, working-class neighborhoods and starter homes are showing the most momentum.
The Biggest Neighborhood Movers
When we look at the data a little more carefully, the results might surprise you. Some of Chicago’s historically overlooked areas are now seeing strong price movement. Here is the price movement when we compare prices from March 2025 to March 2024:
- Park Manor: Up 10.89%
- The Bush: Up 10.30%
- Avalon Park: Up 9.98%
- Fuller Park: Up 9.4%
- Englewood: Up 9.3%
What’s the pattern? The South and West Sides are leading the charge. After years of underinvestment, these areas are seeing renewed interest from both homebuyers and developers looking for value and potential.
The Biggest Neighborhood Losers
There are areas in Chicago that haven’t doing so well over the last year:
- Greektown: Down 12.67%
- Ford City: Down 6.55%
- Chinatown: Down 5.33%
- Near West Side: Down 4.47%
- South Loop: Down 4.11%
Why are these areas down? Many of these areas saw big jumps during the pandemic as buyers went after more space and amenities. What we see now isn’t so much a crash as a natural correction. The South Loop and Near West Side saw a lot of development over recent years, and supply may have temporarily outpaced demand.
These areas are still maintaining high values – they’re just taking a breather after some prolonged growth.
The Geographic Divide
An interesting pattern we’ve noticed is where specifically growth is happening. Traditionally, North Side neighborhoods demonstrated the highest values and strongest appreciation, but now we see the momentum shifting:
- South Side: Multiple neighborhoods showing 7-10% growth
- Southwest Side: Areas like Brighton Park (8.27%) and Marquette Park (8.80%) are doing well
- West Side: Neighborhoods like Little Village (9.62%) and South Austin (8.37%) are seeing strong gains
On the other hand, many North Side areas are seeing more measured growth:
- Lincoln Park: Up 4.58%
- Lake View: up 5.19%
- Wicker Park: Up 3.06%
- Logan Square: Up just 1.35%
Maybe this is signalling a rebalancing of Chicago’s real estate values across the city, with historically undervalued areas catching up with established neighborhoods?
What These Numbers Mean For Buyers
First-Time Home Buyer
You’re in the quickest moving segment right now, especially in areas like South and West Side neighborhoods. You might need to move quickly on some desirable listings, so be prepared.
Move-Up Buyers
The Middle-Tier segment gives you a bit more breathing room. With growth of 2.81%, these homes are appreciating at a healthy pace. You’ll have more negotiating power than entry-level buyers.
Luxury Buyers
With the luxury segment growing at 2.71%, you’ll likely have more negotiating leverage. Some high-end neighborhoods like Bucktown (-0.39%) and River North (-1.56%) are even seeing slight declines, which could create some opportunities for you.
What Else We’re Seeing On The Ground
It’s useful to look at statistics, but it’s also important to take in some more context:
- Mortgage rate sensitivity remains high: Even small rate movements can significantly impact buyer demand and affordability. With uncertainty on which direction the rates will go, we’re keeping our eye on this.
- Property condition matters more than ever: Today’s buyers are less willing to take on major renovation projects. Move-in ready homes are fetching premium prices.
- Neighborhood amenities drive decisions: Buyers want access to parks, quality schools, restaurants, and transit access.
- Generational shifts: Millennial and Gen Z buyers are prioritizing features different from those of their parents, with walkability, energy efficiency, and smart home features in demand more than ever.
A Complete Breakdown Of Price Movement In Every Chicago Neighborhood
Here’s the entire list of home value differences based on values from March 2025 compared to March 2024:
| Neighborhood | March 2024 | March 2025 | % Change |
| Park Manor | $137,602 | $152,585 | 10.89 |
| The Bush | $106,574 | $117,549 | 10.30 |
| Avalon Park | $152,608 | $167,834 | 9.98 |
| Fuller Park | $120,864 | $132,883 | 9.94 |
| Englewood | $100,460 | $110,433 | 9.93 |
| Pullman | $156,030 | $171,256 | 9.76 |
| Little Village | $189,742 | $208,001 | 9.62 |
| West Chesterfield | $156,994 | $171,788 | 9.42 |
| Marquette Park | $206,124 | $224,272 | 8.80 |
| Rosemoor | $158,330 | $172,237 | 8.78 |
| South Commons | $124,260 | $135,141 | 8.76 |
| Rogers Park | $219,603 | $238,083 | 8.42 |
| South Austin | $198,725 | $215,354 | 8.37 |
| Burnside | $137,090 | $148,539 | 8.35 |
| Brighton Park | $249,028 | $269,635 | 8.27 |
| Ashburn | $231,585 | $250,507 | 8.17 |
| Golden Gate | $72,421 | $78,187 | 7.96 |
| West Englewood | $126,806 | $136,811 | 7.89 |
| Stony Island Park | $164,125 | $177,010 | 7.85 |
| Parkview | $226,680 | $244,211 | 7.73 |
| South Deering | $131,011 | $141,112 | 7.71 |
| Oriole Park | $359,719 | $387,172 | 7.63 |
| Chatham | $171,908 | $184,943 | 7.58 |
| Chicago Lawn | $219,610 | $236,175 | 7.54 |
| Gage Park | $216,207 | $232,149 | 7.37 |
| Uptown | $282,124 | $302,784 | 7.32 |
| West Lawn | $260,336 | $279,206 | 7.25 |
| Grand Crossing | $142,231 | $152,265 | 7.05 |
| Edgewater | $232,392 | $248,615 | 6.98 |
| East Garfield Park | $208,098 | $222,494 | 6.92 |
| Roseland | $118,300 | $126,426 | 6.87 |
| Kelvin Park | $328,698 | $351,205 | 6.85 |
| Peterson Park | $464,604 | $495,932 | 6.74 |
| Jeffery Manor | $88,246 | $94,178 | 6.72 |
| Cragin | $317,425 | $337,726 | 6.40 |
| Cottage Grove Heights | $147,268 | $156,678 | 6.39 |
| Belmont Central | $316,262 | $336,454 | 6.38 |
| LeClaire Courts | $227,202 | $241,609 | 6.34 |
| Wrigleyville | $515,344 | $546,490 | 6.04 |
| Archer Heights | $269,095 | $285,283 | 6.02 |
| West Elsdon | $257,275 | $272,745 | 6.01 |
| Gladstone Park | $358,789 | $379,900 | 5.88 |
| West Pullman | $128,263 | $135,779 | 5.86 |
| Brainerd | $169,560 | $179,331 | 5.76 |
| Jefferson Park | $359,768 | $380,364 | 5.72 |
| Big Oaks | $374,086 | $395,502 | 5.72 |
| Sleepy Hollow | $256,925 | $271,612 | 5.72 |
| East Side | $184,695 | $195,238 | 5.71 |
| Hyde Park | $227,669 | $240,603 | 5.68 |
| Pulaski Park | $453,549 | $479,273 | 5.67 |
| Gresham | $161,586 | $170,740 | 5.66 |
| Scottsdale | $265,758 | $280,714 | 5.63 |
| Norwood Park West | $387,095 | $408,842 | 5.62 |
| Hegewisch | $194,743 | $205,654 | 5.60 |
| Forest Glen | $468,779 | $494,293 | 5.44 |
| Belmont Gardens | $337,192 | $355,020 | 5.29 |
| Union Ridge | $357,285 | $376,006 | 5.24 |
| Montclare | $308,405 | $324,434 | 5.20 |
| Lake View | $374,508 | $393,959 | 5.19 |
| Chrysler Village | $217,291 | $228,502 | 5.16 |
| Portage Park | $367,794 | $386,523 | 5.09 |
| Ravenswood | $427,924 | $449,232 | 4.98 |
| Edison Park | $423,203 | $443,975 | 4.91 |
| Wrightwood | $238,658 | $250,369 | 4.91 |
| Schorsch Village | $348,560 | $365,575 | 4.88 |
| Garfield Ridge | $308,379 | $323,276 | 4.83 |
| Hollywood Park | $366,218 | $383,873 | 4.82 |
| Hermosa | $294,120 | $308,274 | 4.81 |
| North Park | $386,313 | $404,843 | 4.80 |
| Humboldt Park | $371,589 | $389,393 | 4.79 |
| West Garfield Park | $169,473 | $177,564 | 4.77 |
| East Beverly | $282,825 | $296,058 | 4.68 |
| West Morgan Park | $309,298 | $323,585 | 4.62 |
| Irving Park | $403,630 | $422,153 | 4.59 |
| Arcadia Terrace | $365,828 | $382,602 | 4.59 |
| Lawndale | $191,177 | $199,940 | 4.58 |
| Lincoln Park | $562,966 | $588,747 | 4.58 |
| Vittum Park | $270,755 | $283,070 | 4.55 |
| Graceland West | $493,652 | $516,103 | 4.55 |
| Sauganash | $553,626 | $578,516 | 4.50 |
| North Austin | $248,156 | $259,258 | 4.47 |
| Clearing | $282,958 | $295,588 | 4.46 |
| McKinley Park | $303,981 | $317,479 | 4.44 |
| Belmont Terrace | $329,913 | $344,322 | 4.37 |
| Norwood Park East | $382,744 | $399,278 | 4.32 |
| East Ukrainian Village | $602,984 | $628,840 | 4.29 |
| South Chicago | $147,359 | $153,635 | 4.26 |
| Old Norwood Park | $500,502 | $521,290 | 4.15 |
| Bowmanville | $557,516 | $580,262 | 4.08 |
| Mount Greenwood | $293,524 | $305,417 | 4.05 |
| West Beverly | $310,525 | $323,020 | 4.02 |
| Marynook | $192,161 | $199,887 | 4.02 |
| Belmont Heights | $330,773 | $343,809 | 3.94 |
| Edgewater Glen | $425,809 | $442,583 | 3.94 |
| Albany Park | $344,033 | $357,423 | 3.89 |
| Ravenswood Gardens | $427,930 | $444,398 | 3.85 |
| Ravenswood Manor | $750,641 | $779,398 | 3.83 |
| Edgebrook | $552,953 | $574,060 | 3.82 |
| Beverly | $413,306 | $428,742 | 3.73 |
| Galewood | $315,410 | $327,174 | 3.73 |
| Kennedy Park | $267,624 | $277,568 | 3.72 |
| Magnolia Glen | $351,239 | $364,065 | 3.65 |
| Near North | $281,648 | $291,924 | 3.65 |
| Longwood Manor | $167,705 | $173,695 | 3.57 |
| South East Ravenswood | $584,077 | $604,325 | 3.47 |
| Wildwood | $562,469 | $581,805 | 3.44 |
| Washington Park | $171,037 | $176,829 | 3.39 |
| Andersonville | $509,383 | $526,516 | 3.36 |
| Roscoe Village | $598,951 | $618,775 | 3.31 |
| West Humboldt Park | $246,888 | $255,024 | 3.30 |
| Noble Square | $547,299 | $565,315 | 3.29 |
| Schorsch Forest View | $379,159 | $391,511 | 3.26 |
| Back of the Yards | $165,046 | $170,121 | 3.07 |
| Wicker Park | $643,830 | $663,538 | 3.06 |
| Mount Greenwood Heights | $326,380 | $336,274 | 3.03 |
| Pill Hill | $184,970 | $190,474 | 2.98 |
| Morgan Park | $184,388 | $189,738 | 2.90 |
| Fernwood | $128,363 | $131,978 | 2.82 |
| The Gap | $362,318 | $372,174 | 2.72 |
| Canaryville | $322,886 | $331,663 | 2.72 |
| East Chatham | $113,648 | $116,726 | 2.71 |
| Heart of Italy | $308,661 | $316,631 | 2.58 |
| Irving Woods | $337,830 | $346,424 | 2.54 |
| Avondale | $459,208 | $470,113 | 2.37 |
| The Loop | $262,150 | $268,328 | 2.36 |
| North Center | $667,623 | $683,346 | 2.36 |
| Beverly Woods | $266,671 | $272,937 | 2.35 |
| Douglas Park | $256,631 | $262,658 | 2.35 |
| Heart of Chicago | $355,419 | $363,620 | 2.31 |
| West Woodlawn | $223,096 | $228,120 | 2.25 |
| Old Town | $378,916 | $387,344 | 2.22 |
| West Chatham | $150,382 | $153,294 | 1.94 |
| Kenwood | $387,410 | $394,694 | 1.88 |
| North Kenwood | $342,948 | $348,836 | 1.72 |
| Budlong Woods | $253,547 | $257,853 | 1.70 |
| Ukrainian Village | $525,340 | $534,151 | 1.68 |
| South Shore | $129,709 | $131,778 | 1.59 |
| Woodlawn | $245,899 | $249,742 | 1.56 |
| Logan Square | $483,789 | $490,326 | 1.35 |
| Washington Heights | $164,286 | $166,385 | 1.28 |
| East Pilsen | $447,114 | $451,972 | 1.09 |
| New Eastside | $393,463 | $397,559 | 1.04 |
| West Ridge | $258,192 | $260,683 | 0.96 |
| Calumet Heights | $175,634 | $177,226 | 0.91 |
| Oakland | $383,303 | $386,770 | 0.90 |
| O’Hare | $203,060 | $204,845 | 0.88 |
| Tri-Taylor | $310,828 | $313,334 | 0.81 |
| University Village – Little Italy | $349,973 | $352,778 | 0.80 |
| Pilsen | $432,311 | $435,575 | 0.76 |
| Gold Coast | $340,970 | $343,502 | 0.74 |
| West Town | $522,279 | $526,068 | 0.73 |
| West Loop Gate | $289,486 | $291,485 | 0.69 |
| Printers Row | $264,590 | $265,846 | 0.47 |
| Bridgeport | $413,034 | $414,670 | 0.40 |
| Dunning | $306,427 | $307,568 | 0.37 |
| Lincoln Square | $469,114 | $469,793 | 0.14 |
| Streeterville | $343,990 | $343,354 | -0.18 |
| Goose Island | $411,993 | $410,912 | -0.26 |
| Bronzeville | $284,371 | $283,374 | -0.35 |
| Bucktown | $602,573 | $600,210 | -0.39 |
| Jackson Park Highlands | $544,746 | $539,409 | -0.98 |
| Cabrini Green | $358,052 | $352,994 | -1.41 |
| River North | $326,454 | $321,359 | -1.56 |
| Dearborn Park | $323,212 | $317,823 | -1.67 |
| Princeton Park | $133,719 | $131,119 | -1.94 |
| River West | $467,942 | $458,023 | -2.12 |
| Fifth City | $226,790 | $221,945 | -2.14 |
| Fulton River District | $361,832 | $352,840 | -2.49 |
| Homan Square | $215,772 | $208,083 | -3.56 |
| South Loop | $320,207 | $307,035 | -4.11 |
| Near West Side | $418,913 | $400,193 | -4.47 |
| Chinatown | $323,692 | $306,433 | -5.33 |
| Ford City | $78,970 | $73,795 | -6.55 |
| Greektown | $422,285 | $368,779 | -12.67 |
The Bottom Line
Chicago’s real estate market so far in 2025 is healthy but varied. Understanding which segment you’re looking at can help you develop realistic expectations.
Whether you’re buying or selling, the key is to grasp neighborhood-specific knowledge so you can make data-driven decisions. The days of one-size-fits-all advice are far behind us.
And that’s exactly why working with a team that understands Chicago at the neighborhood level makes all the difference. We’re deeply connected to what’s happening across the city, and after a decade of helping over a thousand families change homes, we’re always ready to help you.
Want to know what any of these data points mean for your specific situation? Get us to call you, and let’s chat about your real estate goals. No pressure – just insights and friendly advice from neighbors who know this city inside and out.

